
I am a HUGE believer in detailed study — that’s what my trading challenge is all about…as reinforced by my tweet earlier today about one of my students who wrote a great blog post HERE detailing how he came into my strategy doubting its legitimacy, but being willing to give a shot and sure enough he made $10,000 in just a few months (now $28,000 in trading profits four months after that blog post) and now has the knowledge to make consistent profits short selling penny stocks as I’ve successfully done for over 14 years.
Greatly detailed post how this https://t.co/EcfUM63rtt student made $10,000+ shorting penny stocks: https://t.co/QQL9RjerVZ #loveit #study
— Timothy Sykes (@timothysykes) June 23, 2013
5 key quotes from that blog post are:
1. I am a 23 year old college student and here is how I made $10,000 shorting penny stocks
2. I was never really comfortable longing pumps. I wanted to try something new. I figured what better guy to learn short selling from then the grandfather of shorting penny stocks. I signed up to the Tim Challenge
3. I watched Penny Stock Part Deux first. I then dug into the TimChallenge Webinars (my favorite and where most of my learning came from)
4. Trading is not easy. However, shorting pump and dumps gives you an edge. No one knows when a promotion will eventually dump but we all know that it will eventually dump. Learning what signs, promoters history, along with few other things will put you in a position to make a big return in a short amount of time. There really is nothing else like it.
5. The Tim Trading Challenge gave me the tools and education to improve as a trader. I am still learning new stuff 7 months into this experience. I want to thank Tim Sykes and Michael Goode for all they have taught me. I will continue to do my best to make them proud. My account is growing and I believe when its bigger I believe my profit.ly chart might go parabolic 😉
It’s worth noting that when this student wrote that post at the end of February 2013, his profits were $10,000…now just four months later, he has now made $28,000 as you can see EVERY trade detailed HERE.
He is well on his way to making six and possibly seven figures, but more importantly, changing his life after starting with just a small account…just watch and see…this is the beauty of having a real strategy and knowing that there will always be more pumps to trade…there is studying to do, but it’s all upfront and once you get that knowledge, you are prepared for every pump that comes up and while they’re all not exactly the same, they are shockingly similar.
But there’s a big difference between making $28,000 over a few months and making $200,000…in one day…and it’s interesting to note that both of these students of mine are in their early 20s aka they’re hungryyyyyy for success and to create finally secure lives for themselves.
And while both students are very happy with my teachings and their profits, I find it’s the six-figure days that truly open everyone’s eyes to the beauty of short selling penny stocks which is why the detailing of how to make $200,000+ in one day posted below is SO incredibly useful.
After all, I’ve only had a handful of six-figure profit days over my career, but each and every time I have one, I am re-convinced that my strategy is the single best investment strategy around, especially for those people with small accounts.
Below is a GREATLY detailed guest blog post from one of my top trading challenge students who I have written about HERE and HERE.
He is a confirmed speaker at my upcoming Vegas conference October 12-14, 2013 (contact me HERE if you want earlybird discount pricing) and like me, he started with just a few thousand dollars.
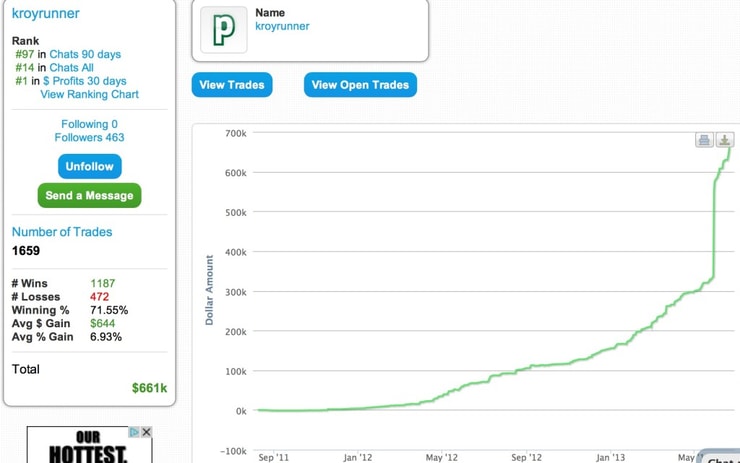
And, like me, he has grown it exponentially with the rate of his trading profits increasing as he has gained more confidence in the strategy and has begun taking larger positions as you can see from his profit chart HERE which has now surpassed $661,000 in profits and he is likely to be my first millionaire student (no pressure or rush Grittani, don’t think in terms of milestones, just continue taking it one pump at a time).
You might’ve seen this video we recorded just last year when he passed $100,000 in trading profits and I rewarded him by taking him on his first overseas trip, a roughly $10,000 all-expenses-paid trip to the Maldives:


Two weeks ago I was in Japan and my video editor and I unearthed some more Maldives videos we shot of Tim Grittani so I did an updated video here:


But I’m gonna soon have to do another video soon since even in two weeks since his big $200,000+ day, he’s made another $50,000 with superb trades on penny stock pumps like these:
https://t.co/bTyHNTBdpX Verified $5,580.97 profit in $ACCS Week of 6/17
— kroyrunner89 (@kroyrunner89) June 22, 2013
https://t.co/x31Q3ptoI1 Verified $4,862.93 profit in $BIZM Week of 6/17, long side of box
— kroyrunner89 (@kroyrunner89) June 20, 2013
https://t.co/PLw4x8Pnx3 Verified $3,333.31 profit in $NORX Week of 6/10
— kroyrunner89 (@kroyrunner89) June 12, 2013
And for you doubters out there, all his trades are verified; something I myself have been too lazy to do (and I like riling up my haters who have a conspiracy theory that what I teach is fake…all of which will soon be a moot point as more and more of my students who actually take the time to watch all my webinar / video lessons / DVDs become millionaires)
So, to you non-students and trading challenge students who haven’t studied hard enough — and sadly, there’s many of you — get inspired by Tim Grittani’s six figure trading profit day.
It’s not luck.
It’s not accidental.
It is predictable.
It is replicable.
(The day this happened, I was filming for my upcoming TV show in Japan so I was sleeping (the US stock market hours suck over there), but several of my top trading challenge students also banked, THIS guy made $22,000, THIS guy made $28,000 and THIS guy who named his son Timur after me made $10,000 on just his small $20,000 account…all have become self-sufficient aka they have learned enough from me that they have taken the training wheels off! Which is my goal for everyone… since sometimes I won’t be there for a live trade as I spend the vast majority of my time building my education empire…hence why you need to study all the videos/use all the tools like THIS that I give you!)
Without further delay I give you the most detailed account EVER of how to make $200,000+ in one day…and know that the stocks Tim Grittani traded exhibited the EXACT same patterns as those stocks in this post from 2011 that I did…not just similar but EXACT…welcome to pumped up penny stocks, enjoy the predictability!
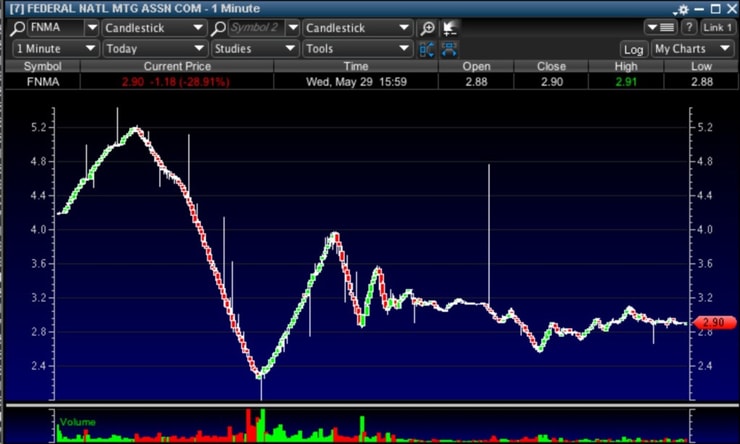
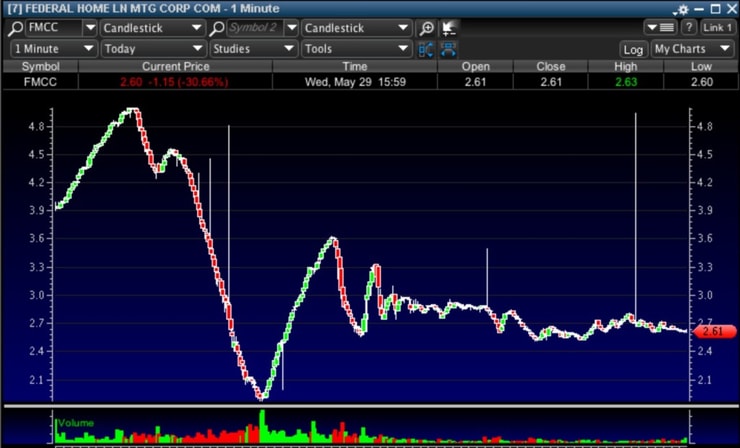
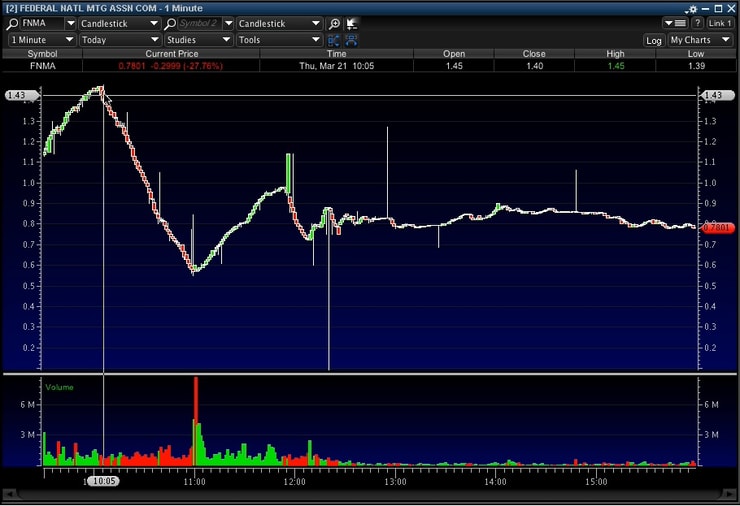
Here you go, I attached charts of each FNMA collapse so you can include them to show how similar the two days were. Hope you like this post!
The past three weeks of trading have been like a dream for me. In just a few weeks I brought in just under $300,000 trading, nearly matching my total profits up to that point. As if that weren’t surreal enough, I now find myself at over $660,000 of total profits since the start of 2012, far exceeding anything I ever expected or thought possible.
As many of you now know, the bulk of these profits came in one unbelievable day, as I brought in roughly $215,000 trading FNMA on May 29.
For those of you unfamiliar with what FNMA did, pull up a daily chart for the last year. In just over two months, FNMA went full blown parabolic, going from $0.30 all the way up to a high of $5.44. As if that weren’t enough, the stock was trading MILLIONS of shares on the most active days, making it an easy entry and exit on almost every trade.
I MUST give thanks to Tim’s high net worth broker (contact me HERE for personal intro) for the role they played in my trading, for both having shares to short of FNMA and for their special route that they offer. It was a big part of my quick executions, which made me more comfortable taking size when the time came to.
Yes, FNMA truly offered a perfect setup, given the chart and the volume it was probably the best setup I’ve ever seen.
But I’d seen a few comparable situations before: LEXG, LTUM, JAMN, and of course FNMA on March 21.
Yep, FNMA gave us nearly an IDENTICAL pattern just a couple months earlier! And on May 29, FNMA’s March 21 chart and these other past charts were very much on my mind.
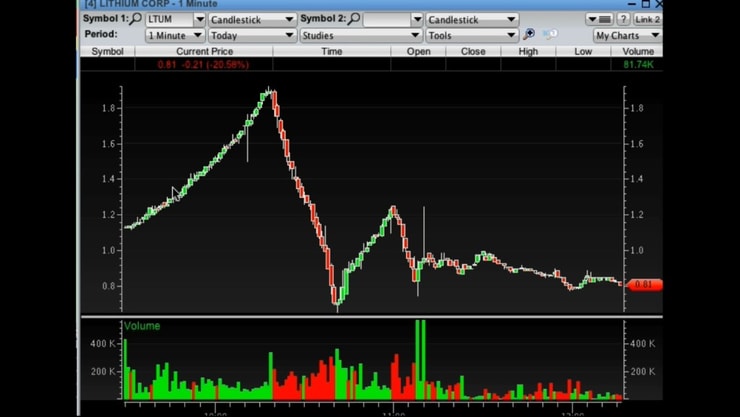
LEXG, LTUM, and JAMN were my earliest exposure to the massive tank and bounce pattern. Yes, we often see major pumps fail, but these were by far the prettiest failures. Nothing but red candles on the way down, followed by massive bounces with nothing but green candles. It’s as easy as it gets.
These three all played out within a month of when I first started trading, and I still remember watching all of them pass me by, overwhelmed by what I was seeing and unsure of how to time them or take advantage of them.
Of course, at the time I had no idea what level 2 was, which is a big part of the reason timing these plays seemed like such an impossibility to me.
As I continued trading and learning, I began to appreciate just how rare these setups were.
I learned level 2, watched other pumps play out similarly (but nowhere near as perfectly), studied Tim’s video lessons, watched Nate call bottom after bottom perfectly in his chatroom as pumps were tanking, and waited for the next time I might see something anything even close to comparable to these original monster pumps.
I began to understand exactly what I had missed, and was determined to take advantage of it next time it came my way. But in the meantime, I practiced. While I often failed to take advantage of the short side on these plays, almost every major pump with any kind of liquidity I’d throw myself into the mix on the bounce, analyzing the level 2 and looking for the perfect entry as the play was bottoming.
These plays often were nowhere near as easy, with a fake bottom or two along the way, but they were great practice and I grew more and more confident playing them. Of course I took some losses along the way (and I still do sometimes), but I always kept my size under control and knew that the annoyance of a few losses along the way would be well worth gaining the experience and confidence in these times of high volatility.
Fast forward two years.
On March 15, after about three years of sideways trading (and slowly fading), FNMA suddenly sprang to life. Over the next four trading days, FNMA traded incredible volume with sustained spiking, rocketing from $.30 closing March 20 at $1.08. I’d already been short biased on FNMA for a couple days waiting for a price correction, and the higher and higher it went the more excited I was to play the short.
Rather than wait for the stock’s momentum to snap and short on a green to red move, I chose to attack the morning spikes, shorting into them and looking to cover into the pullback if the stock looked to hold up. March 21 turned out to be the end of FNMA’s initial surge, and I brought in roughly $17,000 on the tank and bounce which up to that point was my biggest day ever.
But I played it far from perfectly.
I had shorted a bit early into the morning spike, and the emotional distress of getting squeezed a bit led me to cover up my short position well before the bottom. I was happy with my big day, but I knew it could have been better executed.
I slowly forgot about FNMA as volume faded off and it traded sideways for the next month, figuring that the play was over and it would slowly fade off. FNMA sprang back to life in early May, and over the course of the month slowly built back up to a breakout which sent it skyrocketing up to an eventual high of $5.23.
The bulk of this move came in a parabolic spike over a few days, very similar to the spike we saw in late March. As I watched this unfold, I knew I was going to get my redo.
I decided to go with the same strategy I attempted in March, short into spikes.
My first real attempt actually came on May 28, the day before the collapse.
FNMA had a morning spike up to the $3.80s, which I nailed perfectly, splitting the trade between two of my brokers.
As the stock began to panic and pull back, I watched level 2 like a hawk, waiting to see if we’d get a full blown collapse or if the stock would hold up near its morning low of $3.50.
Judging by the level 2 action, I quickly determined that there was still plenty of support, and I covered up both my trades for quick and easy gains.
https://profit.ly/1MnXaN
https://profit.ly/1MnXaU
While I had not gotten the collapse I had hoped for, it reinforced my strategy in my mind.
By simply playing the price action and letting that tell the story, I’d brought in nearly $6k in gains. I did not fall victim to thinking “it has to come down eventually so I’ll stay short”, I took my profits and knew I could reenter the trade later if it looked like it might collapse.
It’s a great thing I did too, since FNMA squeezed above $5.00 the next morning. I would have not had nearly the level of success I did had I gone through the emotional swing of staying stubborn in a trade and getting squeezed for over $1.00/share. I might have even covered into the spike for a loss.
The next morning turned out to be the morning I’d been waiting for.
After a slight gap up, the level 2 seemed to indicate that FNMA was poised to spike rather than drop.
I initiated a small long position for the morning spike, knowing that I didn’t want to take size since we were nearing a collapse and it was certainly risky playing the long side at these levels.
I sold the first time I saw any kind of topping on the level 2, not wanting to be greedy and push my luck.
I remembered back to the morning of March 21, and how there had been a few fake tops on the level 2 before FNMA finally collapsed. I remembered how the bid had soaked up size on the level 2 every time it tried to pull back, only to continue on to new highs.
I decided I would still take shorts into this topping action, but be very quick about cutting my loss if I believed I saw similar action to the fake tops on March 21 in the level 2.
In fact, I did wind up having to take a few small losses as FNMA’s morning spike continued. But I cut losses VERY fast on all of them, and only gave back a small portion of my morning profits up to that point.
https://profit.ly/1MnXmB
https://profit.ly/1MnXmP
https://profit.ly/1MnXmR
With each fake top I grew increasingly confident that we were nearing our morning pullback.
The spike had now gone roughly $1/share in 45 minutes, the spike was slowing, and I knew a pullback was coming whether it be a small one similar to the day before or a full blown collapse. I initiated my shorts with size at nearly the dead top of the spike, and watched as the pullback began.
https://profit.ly/1MnXmV
https://profit.ly/1MnXlS
As I watched the beginning of the collapse, I was completely focused on the level 2 action, watching and waiting for any signs of strength that may suggest the stock would hold up and rebound.
Unfortunately, at one point I thought I might have been seeing such strength, which led to my early covers on this initial batch of shorts.
I quickly realized my mistake however, and took back my positions slightly lower, even adding to one as the collapse continued and snapped the all important green to red price level.
https://profit.ly/1MnXlT
https://profit.ly/1MnXn2
As the tank continued into the $2s, I began covering small pieces of my shorts into the weakness, ensuring that I locked in some profits along the way.
In one account I covered perfectly at just about the dead bottom of the panic at $2.30.
Between these shorts, I was now up roughly $80,000 on the day. Despite this success, I knew my work was far from over.
It was time to play the bounce.
Upon the completion of my covers, I almost immediately began working into a long position.
It was the first time since the beginning of the collapse that FNMA’s bid had began to show any kind of strength, and there was a massive volume spike as it churned in the high 2.20s trying to bounce.
I remembered that the March 21 tank and bounce hadn’t had any fake bottoms, and how there had been a big surge in volume as it bottomed and spiked on that day as well. I eventually worked myself into a total of 65,000 shares long, splitting it between three brokers.
https://profit.ly/1MnXlV
https://profit.ly/1MnXlR
https://profit.ly/1MnXn3
As I waited for the bounce to begin accelerating, I watched the level 2 action like a hawk, ready to sell if anything even looked slightly wrong.
Eventually, the momentum did shift, and we were left with a tremendous bounce.
In Speedtrader I randomly took some shares off along the way into the strength, as I anticipated execution issues were most likely with them. I managed to sell my entire high net worth broker position nearly dead top of the bounce at $3.93, over $1.50/share of profits.
My profit on the short side had seemed unreal to me, but the bounce play was even more rewarding as I raked in a total of $93,000 between all of my long positions.
To finish off the bulk of my gains, I decided the reshort the bounce.
After a straight up bounce of almost $2/share, another price correction seemed incredibly likely.
I shorted at $3.90, and covered it all up at $2.90 for an easy $1/share and another $31,000ish in profits.
Once again, level 2 played a huge role in this trade as analyzing the price action helped me time my short and cover nearly perfectly.
I made a few other trades throughout the day to round out my $215,000 in profits, but these three trades were where the bulk of the gains came from. By focusing on the 60% drop from the highs, 80% bounce off the lows, and then the 25% drop off of the bounce, I was able to have a day unlike anything I’d ever experienced before.
Volatility truly is a trader’s friend, and with three massive moves like this on such incredible volume it was very easy to capture the bulk of each opportunity and trade size without taking on very much risk.
Of course as always I thank Tim, Nate, and Michael for helping me develop along the way into the trader I am today. I don’t know when, if ever, I’ll have a day like this again… but I know the next time we see a spectacular setup like this I will be ready because of the framework they provided for me!


Leave a reply